Top 4 mistakes that are destroying your analytics
Google Analytics is a powerful tool and is constantly being expanded and improved. The amount of data it collects, and …

Google Analytics is a powerful tool and is constantly being expanded and improved.
The amount of data it collects, and its vast interface can be daunting. But it is also what makes it a crucial component of any digital strategy. Knowing how your website is used allows you to improve the user experience and make better decisions.
I look at a lot of different Analytics accounts every day and I’m surprised (and a little saddened) that many companies don’t know how to set up their account in the right way. Once the code is added and checked it’s working, it tends to get ignored.
The four most common mistakes I see are:
- Not knowing if an Analytics account exists and potentially missing out on valuable data
- Tracking internal traffic, which ultimately leads to unreliable data
- Lack of goals to measure a website’s ROI
- Being obsessed with quantity instead of quality
I’m going to look at each of these and show you how to fix them.
1. Not owning the account, or not knowing who does
This normally happens when websites are handed over from person to person – if an organisation has undergone a lot of change, details may not have been recorded properly. The most common issues are:
- You don’t know if Analytics has been installed.
- You know Analytics is installed but don’t have any log-in details for the account to access.
- You have log-in details but the website is a property under an account that you don’t own, e.g. a website agency’s account.
I have no idea if Analytics is on my site
You can check this quickly:
- Go to your website homepage
- Right click and select “Page source”
- Search for “var _gaq”. You are looking for code that looks like this:
var _gaq = _gaq || [];
gaq.push([‘_setAccount’, ‘UA-xxxxxxx-x’]);
gaq.push([‘_trackPageview’]); - If you do not see this code, then Analytics is not on your website.
Setting up Analytics is straight forward. You will need to set up a Google Account (if you don’t have one already) and generate tracking code. Google outlines the process in their “Get Started with Analytics” page.
It’s on my site but I don’t have the log-in details
Google have process for retrieving these. The best approach is to contact them by telephone, chat or email.
The website has been set up under our old agency’s account
This won’t prevent you from accessing Analytics (as the agency can give you permission), but it will be limiting.
Certain functionality is only available to admins of an account, e.g. filtering. If you do not have admin access to the account, you will not be able to fully control the analytics for the website. Your old agency will be reluctant to give you access to their account as you would be able to see all properties (i.e. potentially other client accounts).
This is due to the way that Google wants you to set up analytics for websites. You do not need to set up separate accounts for different websites – you can have all your domains in one account, set up as follows:
- Account – this is the top level. If you have this access you can control everything.
- Property – this is typically the domain you want to track. You can have multiple properties in an account. Properties cannot be transferred between accounts.
- Views – different data sets for a website. For example, you can create a view that only shows you data for one country. Again, views cannot be transferred between properties or accounts.
This is an ideal account structure:
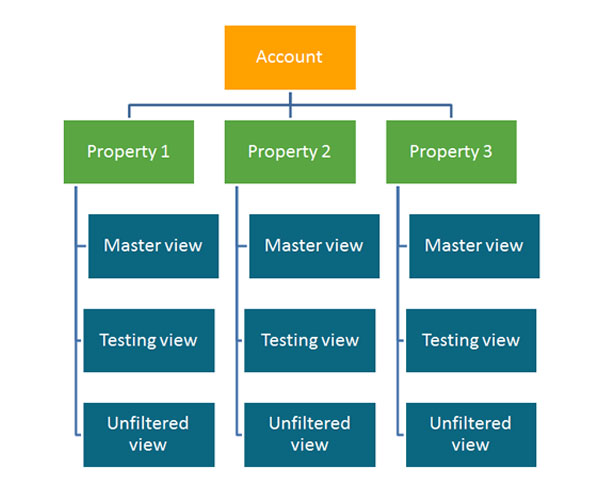
- Master view – this has all settings and filters applied. It would be the view you use for reporting.
- Testing view – allows you to test configuration changes before applying to the master view.
- Unfiltered view – no settings or filters applied. Consider this the raw “back up” of analytics data.
These views are the best way to manage and protect the analytics data.
Remember that when you apply filters to a view, it is filtered from the date you set it – it is not retrospectively applied.
If your website has been set up as a property in another account, then you will have to set-up a new Analytics account and install new tracking code.
This will be inconvenient as you may have to flip between two Analytics accounts for data, but long-term it is the best action as you will fully own and control the website data.
Unfortunately there is no easy way to download all the analytics data for a website. You will need to retain access to the old Analytics view. As a precaution, download the relevant .csv files for data you would want a record of, e.g. 12 months’ worth of traffic sources, goals etc.
2. Not filtering out the office IP addresses
Google Analytics records visitors and sessions by identifying their IP address – this is how they know if you are a new visitor or a returning one.
Every home and office has an IP address. If you or anyone internally is using the company website, then Google Analytics will record this activity unless you tell it not to.
Why should I filter out the office IPs?
Analytics give you valuable insight into the most popular pages and behaviour of visitors – inevitably internal behaviour will be different to external visitors. This data helps you make decisions about website structure, design and other marketing activity – if it is based on skewed data, then it could be disastrous.
How to filter out an IP address
- Go to the view you want to apply the filter to, e.g. Master view.
- Click on “Filters”.
- Click on “+ NEW FILTER”. NB You will need to be an admin of the account to do this. If you do not see this button, then you are not an account admin.
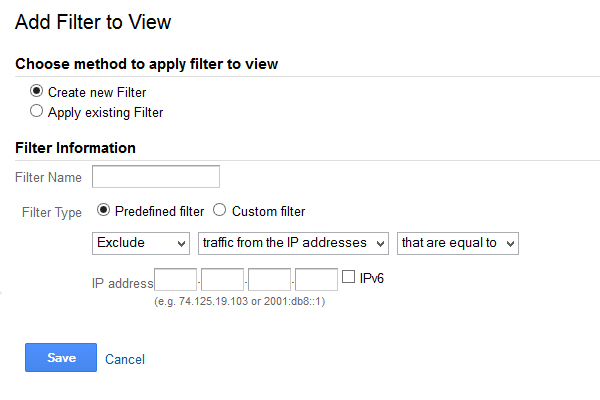
- Select “Create new Filter” and give it a sensible name, e.g. Office IP.
- The default will be “Predefined filter”. Check that it is set to “Exclude”, “Traffic from the IP addresses” and “that are equal to”.

- Enter the IP address. If you don’t know what the IP address is, Google “What’s my IP” and Google will tell you!
- Click save- The filter will start. Remember that it is not retrospectively applied.
3. Not setting up goals
Setting up goals saves reporting time and makes it easier to calculate the ROI on the website and user activity.
You should set-up two types of goal:
- Micro – an activity that contributes to a lead/sale. This is usually described as an “event” in Analytics.
- Macro – a lead/sale from your website.
Carefully think through what goals you want to set up. Typical goals include:
- Downloading documents (micro).
- Newsletter sign-up (micro).
- Completing contact us form (macro).
- Clicking on a specific link (micro).
- Moving from one section of the website to another, e.g. from a blog page to a service line page (micro).
Analytics has goal templates and a gallery saving you time (and headaches) for set-up. You can access this in the goals section.
How to set up a custom goal
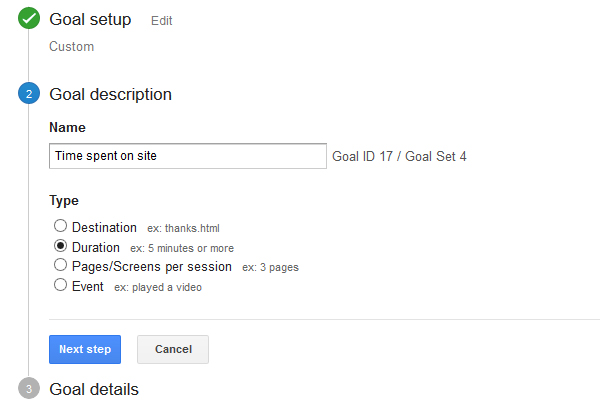
Let’s set up a goal for time spent on the site. This is a good goal to include as it indicates the % of your audience that are engaged with the website:
- Go to the view you want to add a goal to, e.g. Master view.
- Click on “Goals”.
- Click on “+ NEW GOAL”. NB You will need to be an admin of the account to do this. If you do not see this button, then you are not an account admin.
- Click on Custom.
- Enter the goal description, e.g. Time spent on site, and select “Duration”. Click on “Next step”.

- Select greater than and enter the time target, e.g. 2 minutes.
- You have the option to add monetary value to the goal (which we always recommend).
- You also have the option to verify the goal – this will tell you if it is working correctly based on the previous 7 days’ data.
- Click on “Create Goal”. The goal will start to be applied – remember that it is not retrospectively applied.
Check out Google’s support pages for more information on goal set-up.
4. Being obsessed with numbers
It’s easy to get caught up with stats such as visitor numbers, time on site and page views.
These numbers are important and will often alert you to traffic problems if they drop, however they should be viewed with other data in mind such as quality and value of leads/sales generated and on-page visitor behaviour.
Setting up goals can help this (see above) but you also need an effective process offline. If a user opts to phone you rather than complete a form, purchase or email, then you need to identify how they heard about you.
Are you asking?
Your sales team should always ask the question and this should be recorded in a CRM system. This makes it easy to track and assess what online marketing is working.
If enquiries are coming from the website, then you can also ask what keywords they used. This helps overcome the (not provided) keyword situation in Analytics.
Monitor on-page behaviour
Heat mapping is a great way to understand where users click on a page and how far down they scroll. This helps you plan and design better websites, as well as addressing conversion problems.
You can use In-Page Analytics within Analytics (under the Behaviour menu). This will show you where users are clicking – the “hot spots”.

Other popular heat mapping tools are Crazy Egg, Click Density and Clickable.
A/B testing
If you are achieving traffic numbers but no conversions, then you need to find out why.
A/B testing allows you to try different designs and content elements to understand user behaviour. You could be making a website design mistake that is scaring visitors away.
Analytics provides “Content Experiments”, which allow you to test up to five versions of a page, each with a separate URL. You will need to plan what you are going to change, e.g. button colour and then spend time setting the experiment up.
Alternatives to Content Experiments are third party platforms such as Optimizely and VisualWebOptmiser. These will integrate with Analytics and other software such as heat mapping to give you an excellent idea of on-page behaviour and how design and copy changes affect conversions.
If you are making any of these mistakes, don’t panic!
They are all fixable, and in some instances can be done quickly.
Some items will require developer input. For example, adding heat tracking or A/B testing code, but this is straightforward and not complex.
Most importantly, continue to keep up-to-date and learn about Analytics. Studying and sitting the “Digital Analytics Fundamentals” at Google’s Analytics Academy is an excellent place to start.
If you think you are making these mistakes, why not send us an email to find out how we can help?
More insights from the team


