Can We Predict X Factor 2016 Winner Using Digital Data?
Tonight is the X Factor 2016 final and we have two very worthy finalists in the shape of Saara Aalto …

Tonight is the X Factor 2016 final and we have two very worthy finalists in the shape of Saara Aalto and Matt Terry. Whilst the show is no longer the ratings juggernaut it might have been 10 years ago, this year’s competition’s ratings look to be up compared to last year’s series (reaching over 9 million viewers on four occasions).
One of the interesting things we have seen during the show’s 13 series is the rise of social media. The phone vote is now supported by a voting app and this year the performances have been released on Spotify.
So can we use digital data to predict who the winner might be? Join us as we take a look!
Spotify X Factor 2016 data
Matt Terry dominates the Spotify play data with almost 1.25 million total plays for his performances over the 9 weeks (when the contestants have sung twice, we have only used one performance) compared to Saara Aalto’s 825,000.
That’s almost 50% more.
However, the data is not so simple.
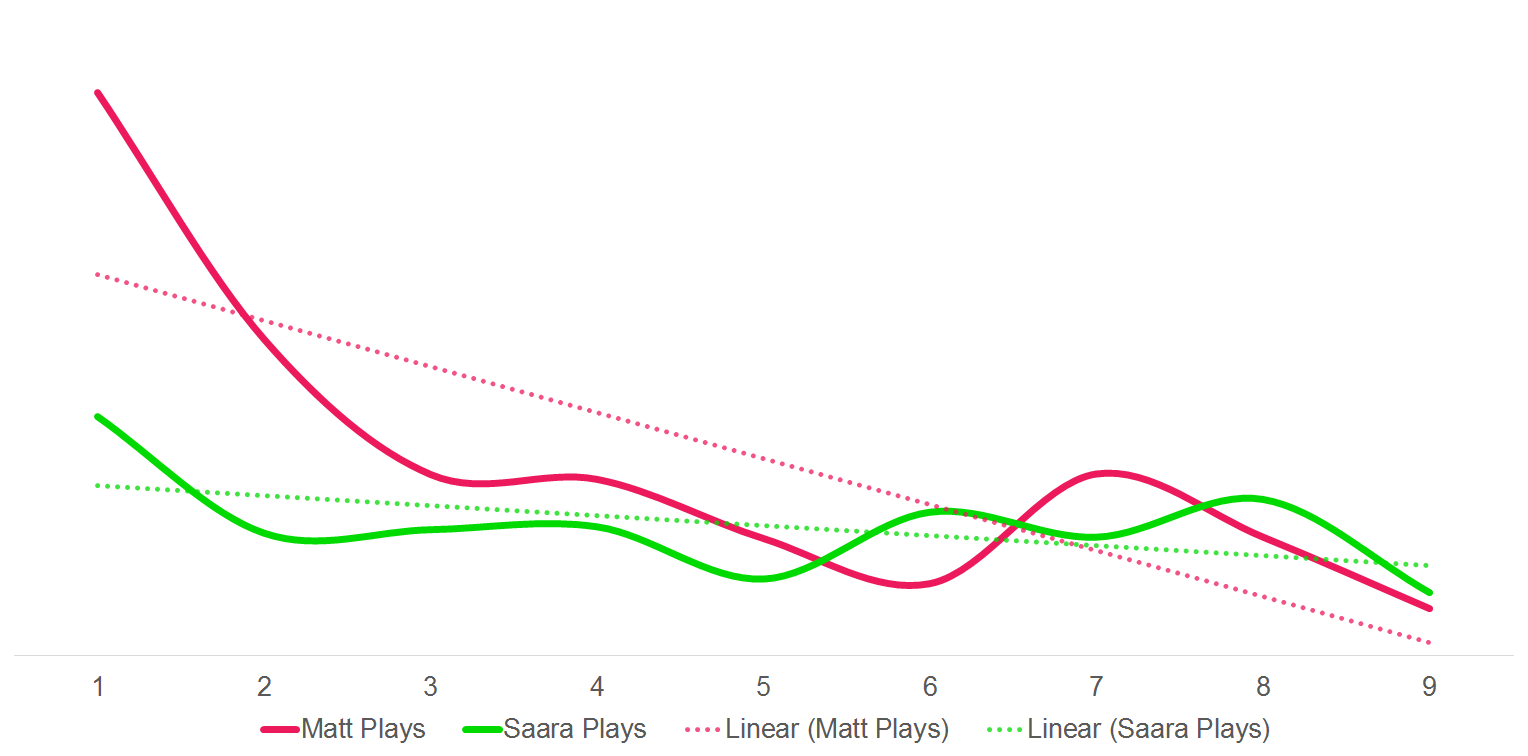
Matt’s figures are dominated by his early performances with his first four performance recordings having more plays than Saara’s total combined. We know that Matt has long been a favourite to win the show (as an aside, the overwhelming majority of winners and runner ups are male soloists and Matt fits this mould down to the t), and during the early weeks of the show Saara struggled to win over viewers appearing in the sing-off three times no less.
But what about the last five weeks?
Matt has a total play count of 376,324 and an average play count of 75,265. This compares to 392,709 total plays for Saara and an average play count of 78,542. A narrow lead for Saara.
In fact, in the last five months, Saara’s performances have had more listens than Matt’s on three occasions.
In the semi-final, Matt’s performance of Say You Love Me has only 33,000 plays (his lowest figure) compared less favourably to Saara’s Chandelier performance with over 44,000 plays (also her lowest play count).
In the graph above we can see Matt’s huge lead shrink and Saara start to make ground.
X Factor Google Trends Data
We have looked at Google Trends data in the UK to see who has been searched the most. As we have recently seen with the US Presidential Election, there is a lot of valuable information we can see here.
30 day Google Trends search data
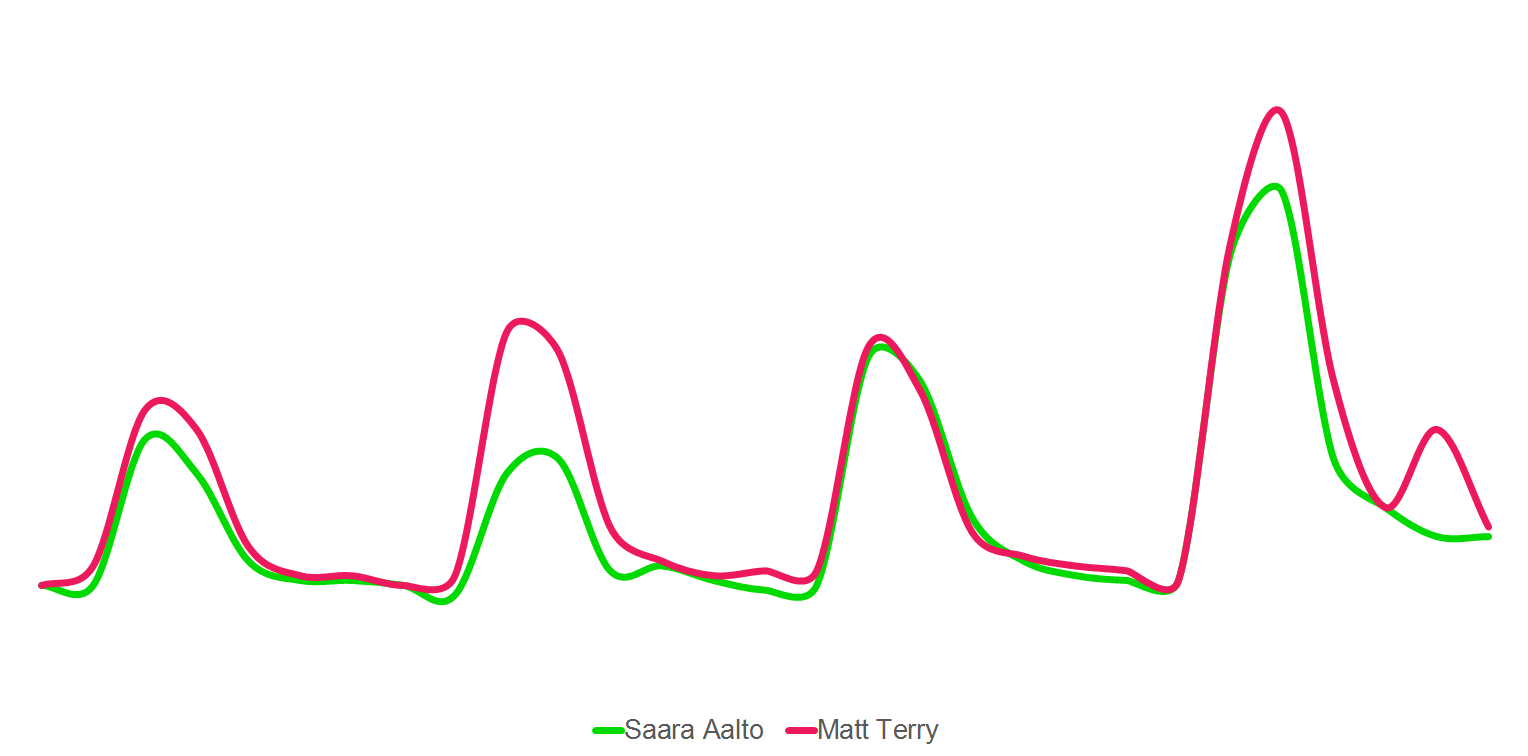
Matt Terry leads Saara Aalto consistently over this period – more searches in each weekend, although the gap has been shortening in recent weeks. When people say Matt has been the long running favourite, the Google Trends data does appear to reflect this.
Saturday X Factor Final Google Trends search data
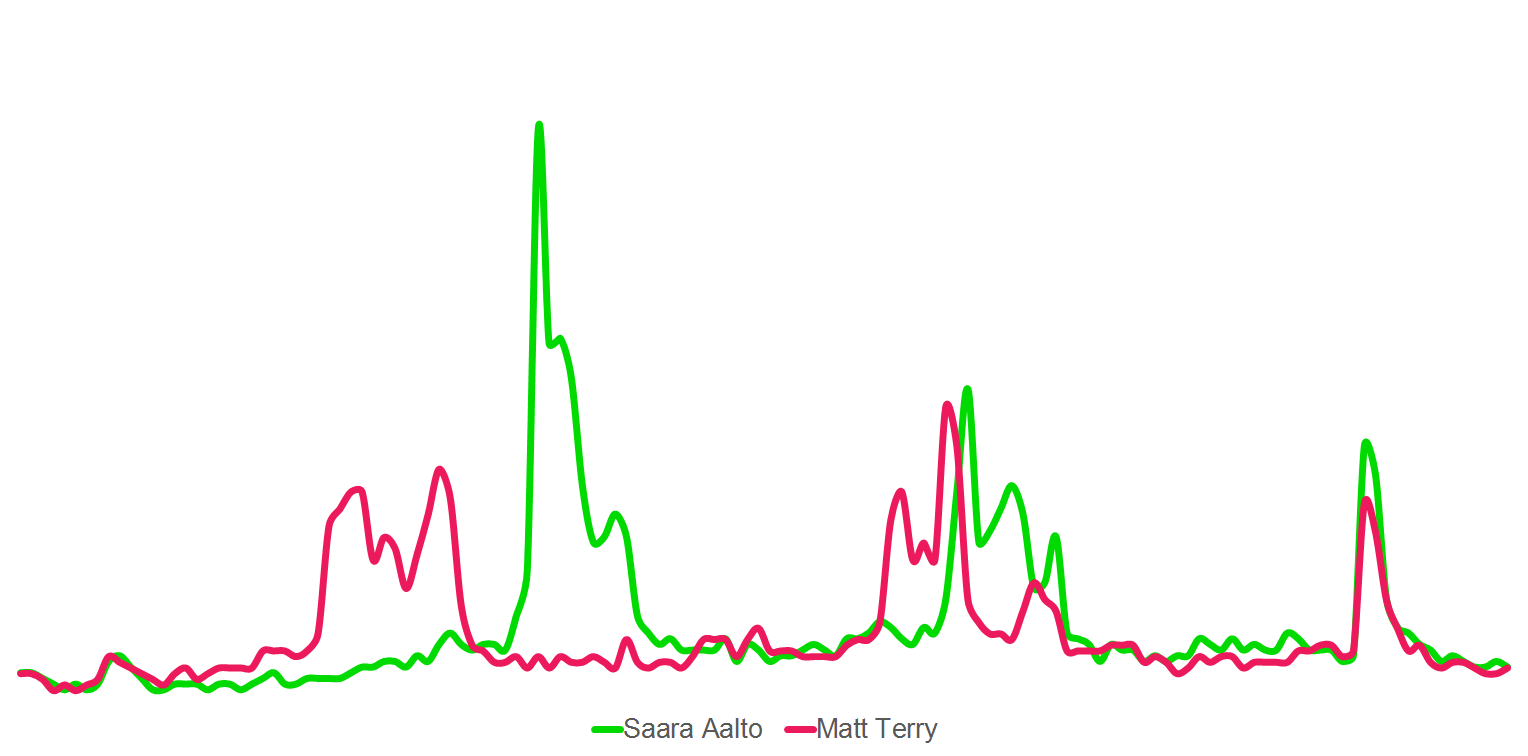
For Saturday’s first part of the final however, Saara Aalto is the bigger search winner. Her first performance of Tears for Fears’ Everybody Wants to Rule the World completely dominates the show. Saara’s second performance also narrowly beats Matt’s second performance.
Finally we can see that the announcement of Saara reaching tonight’s final grew a bigger search interest than Matt’s (the last peak in the graph).
This might well suggest that Saara’s growing popularity is outpacing, and outgrowing, Matt’s early lead and if she can continue to win over X Factor viewers she might pull out the biggest come back victory the TV show has ever seen (the released voting figures typically show there is an early favourite and they consistently dominate the vote).
X Factor Twitter Data
| Metric | Saara Aalto | Matt Terry |
|---|---|---|
| Posts | 535 | 551 |
| Users | 429 | 417 |
| Reach | 7,776,609 | 7,770,6513 |
| Impressions | 15,252,153 | 15,291,576 |
| Sentiment | 90 | 89 |
| Female % | 64.0 | 62.8 |
| Male % | 36.0 | 37.2 |
We can see that on Sunday morning, Matt Terry had received more tweets but from viewer users. He had a higher number of impressions but a lower reach altogether.
The sentiment scores are practically the same but interestingly Saara has a higher percentage of females tweeting about her. Typically the X Factor voting demographic is seen as more female orientated (one of the reasons why male soloists do so well on the show).
The fact that Saara appears to have a slightly higher percentage of women engaging with her is interesting and could point to a win if she can get the voting public to vote for her.
X Factor YouTube Data
This is one area where Saara stomps all over the rest of the competition. Typically YouTube plays data is a good signal for popularity, but it’s difficult to ascertain how many of Saara’s plays are from Finland compared to the UK.
Nonetheless, the figures for Saara are quite staggering.
Matt’s combined YouTube plays come to just shy of 5,000,000 at the time of writing with an average view count of 550,727.
This compares to Saara’s total YouTube plays of over 17,000,000 and an average view count of almost 2,000,000 – an average over 250% higher than Matt’s.
We have seen in previous years that YouTube popularity does not translate into X Factor success, suggesting the voting public demographics are different. This is in addition to the fact that Saara’s Finnish fan base may be skewing the data considerably. Nonetheless, Saara’s YouTube dominance should be lauded.
Conclusion
In conclusion, the data is unclear – either Matt or Saara could win and in a year where opinion polls have been considerably unreliable, it’d be silly to draw any specific conclusions on the predictions of either.
It’s still fascinating to see trends and patterns in the data to highlight potential outcomes and the role of digital data in wider digital strategies.
More insights from the team


