A quick guide to Twitter’s Analytics Dashboard
Previously Twitter’s Analytics Dashboard was only available to advertisers and verified users. Anyone who tweets in English, French, Japanese and …

Previously Twitter’s Analytics Dashboard was only available to advertisers and verified users. Anyone who tweets in English, French, Japanese and Spanish can now access it at analytics.twitter.com. Data starts from 1 October 2013.
Many people say to me that they know Twitter plays a positive role in their social media marketing strategy and advertising but find it hard to understand its impact.
This dashboard will help unravel some of the mystery and I can see it improve the way companies use Twitter in two ways:
- Getting tweets to followers at the right time – with impression data it’s easier to see what tweets have had less exposure than others. These can be scheduled for a better time to increase engagement.
- Planning content – the impression and engagement data will tell you what topics rock followers’ worlds the most. Use this to plan even better content.
What does the dashboard do?
The dashboard gives an overview of how individual tweets perform, as well as a 28-day average. This data can also be extracted so you can manipulate it offline.
You can also track follower growth, as well as the interests, location and gender of followers. Promotional tweets and Twitter card data also sit within the dashboard.
Features that I love about the dashboard are the ability to export the data and individual tweet performance data. This will make it much quicker and easier to report on Twitter performance.
There are lots of other products that will report on Twitter data for you, e.g. HootSuite, SumAll, but this dashboard will give you more data on specific tweets.
Tweet data
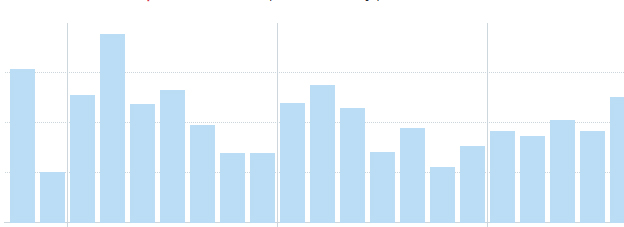
When you log into Twitter Analytics, the first screen you see is a summary for tweet impressions over the past 28 days.
Tweets and an individual breakdown of their performance appear underneath. If you’ve used Twitter Advertising before, this will be familiar. You can now see:
- Impressions – the number of times users saw the tweet on Twitter
- Engagement – the number of interactions with a tweet. This can be replies, favourites, follows, retweets and clicking anywhere on the tweet such as the hashtag, profile name or link.
- Engagement rate –number of engagements/number of impressions.
This makes it much easier to track tweets that are performing well beyond just link clicks, retweets, replies and favourites. The engagement data helps you understand reach and success.
Clicking on a tweet will reveal more detailed information about it.
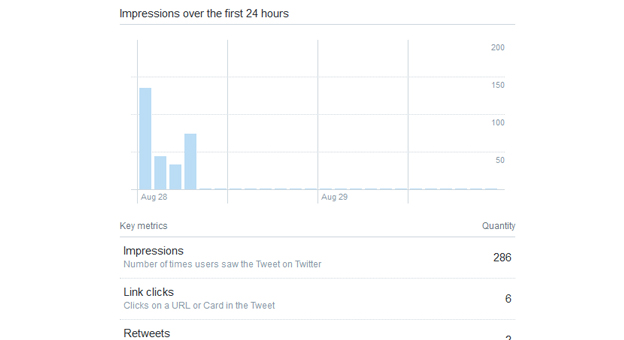
You will see:
- Impressions
- Detail expands (number of times a user clicked to view more details)
- Link clicks (to a URL or card in the tweet)
- Retweets
- Replies
- Favourites
This data can be exported to a csv file so it’s easier to see how tweets compare to each other, as well as what the most popular ones are. Note that it will dump data from 1 October 2013. However if you’ve not used advertising before then you will start gathering data now.
For reporting you may want to divide the tweet activity into micro and macro activity:
- Micro – Impressions, detail expands, favourites: actions where the user is aware of you but has not directly interacted with you.
- Macro – retweets, replies, link clicks: actions where the user is actively engaging with you.
Use existing data to set benchmarks and measure how Twitter is improving or not, e.g. average number of clicks for a tweet, average number of a tweet’s impressions.
28-day averages
These are on the right-hand side of the page and give you a handy overview of how tweets are performing. The graphs don’t reveal anything beyond this average. Hopefully Twitter are working on a more in-depth graph that will give you more information on specific tweets, as well as allowing you to toggle the dates for the averages.
Follower data
The follower graph is a great for an at-a-glance overview of follower growth. It gives at least two years’ worth of follower data.
Unfortunately you can’t download the graph data or a list of followers. Again, this may be something that Twitter will allow you to do at a future date.
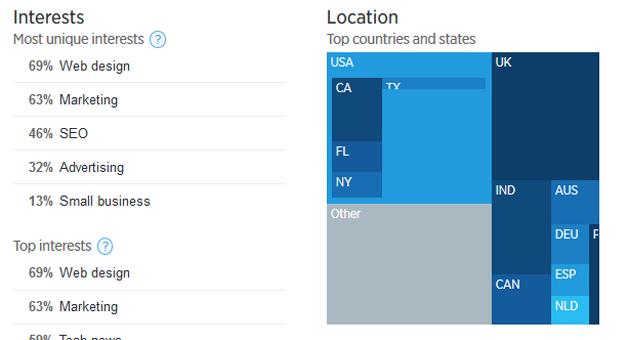
What Twitter now gives you is more information on what followers are interested in and where they are. You can now see their top interests – Twitter has also included “unique” interests though it’s unclear what is unique about them (expect to see them listed in the top ten interests). Knowing these will help you plan better content for digital marketing activities, as well as what to tweet about.
The location data is not particularly detailed. Twitter will give you the top five cities and an unusual square representation of countries followers are in.
Follower gender is also listed, as well as who your followers are following. This is worth checking out to see what subjects they are tweeting about and using it to help plan content.
As the follower data is not as rich as the tweet data, it’s more difficult to report on. Items you may want to include and track over a period of time are follower interests, e.g. do they stay static or have new ones arisen? Should you be writing about these new topics? When location data is more fruitful, you could check and track where you are most popular.
Thumbs up for Twitter’s dashboard!
I think the dashboard is an excellent start for gaining more information on tweets and followers. There are obvious improvements for Twitter to make, e.g. allowing you to control date ranges for tweets.
The interface is easy-to-use and makes it quick to pull-out relevant data. I know it will save me reporting time and gain more insight into content our followers want to read.
Over time I think the dashboard will evolve (as Google Analytics did) and become an essential tool to understanding how Twitter affects social and digital marketing strategies in the long-term.
What do you think of the new Twitter Analytics? Has it made reporting easier? Tell us what you think @minttwist.
More insights from the team


